Electron Plugin
The plugin provides the ability to test Electron-based desktop applications. VIVIDUS uses ChromeDriver functionality to interact with the application.
Installation
implementation(group: 'org.vividus', name: 'vividus-plugin-electron', version: '0.5.0')Profile
The available profile is desktop/electron. It should be used together with web/desktop/chrome.
configuration.profiles=desktop/electron,web/desktop/chromeProperties
| The properties marked with bold are mandatory. |
| Property Name | Acceptable values | Default | Description | ||
|---|---|---|---|---|---|
|
An absolute file path. |
The path to the executable file of the application under test. |
|||
|
The version string, e.g. |
The chromium version used to build the application. The simplest way to determine the version is to run the tests without this property and then you should receive error message like this one: 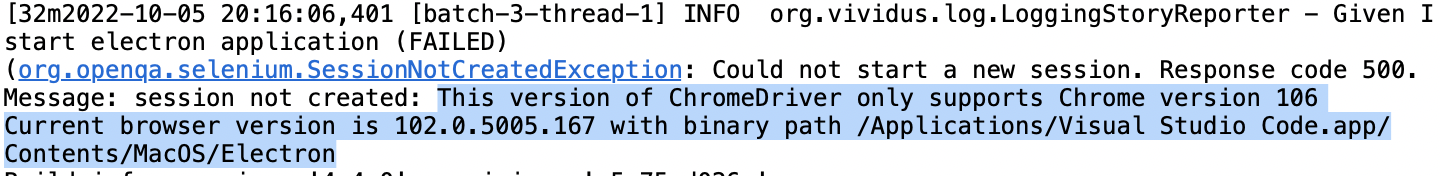
|
|||
|
The space-separated list of arguments e.g. |
<empty> |
The list of command line arguments for the application. |
Steps
In order to interact with the user interface one can use the steps from Web Application Plugin.
Start application
Starts the application under tests.
Given I start electron applicationGiven I start electron application
When I wait `PT1M` until window with title that contains ` | Microsoft Teams` appears and switch to it
When I wait until element located `id(searchInputField)` appears|
Electron based applications may have one or more windows at the same time. Consider usage of the window waiting step to manipulate with the windows during testing. |
You could also find the complete example for Elector-based desktop application tests here.
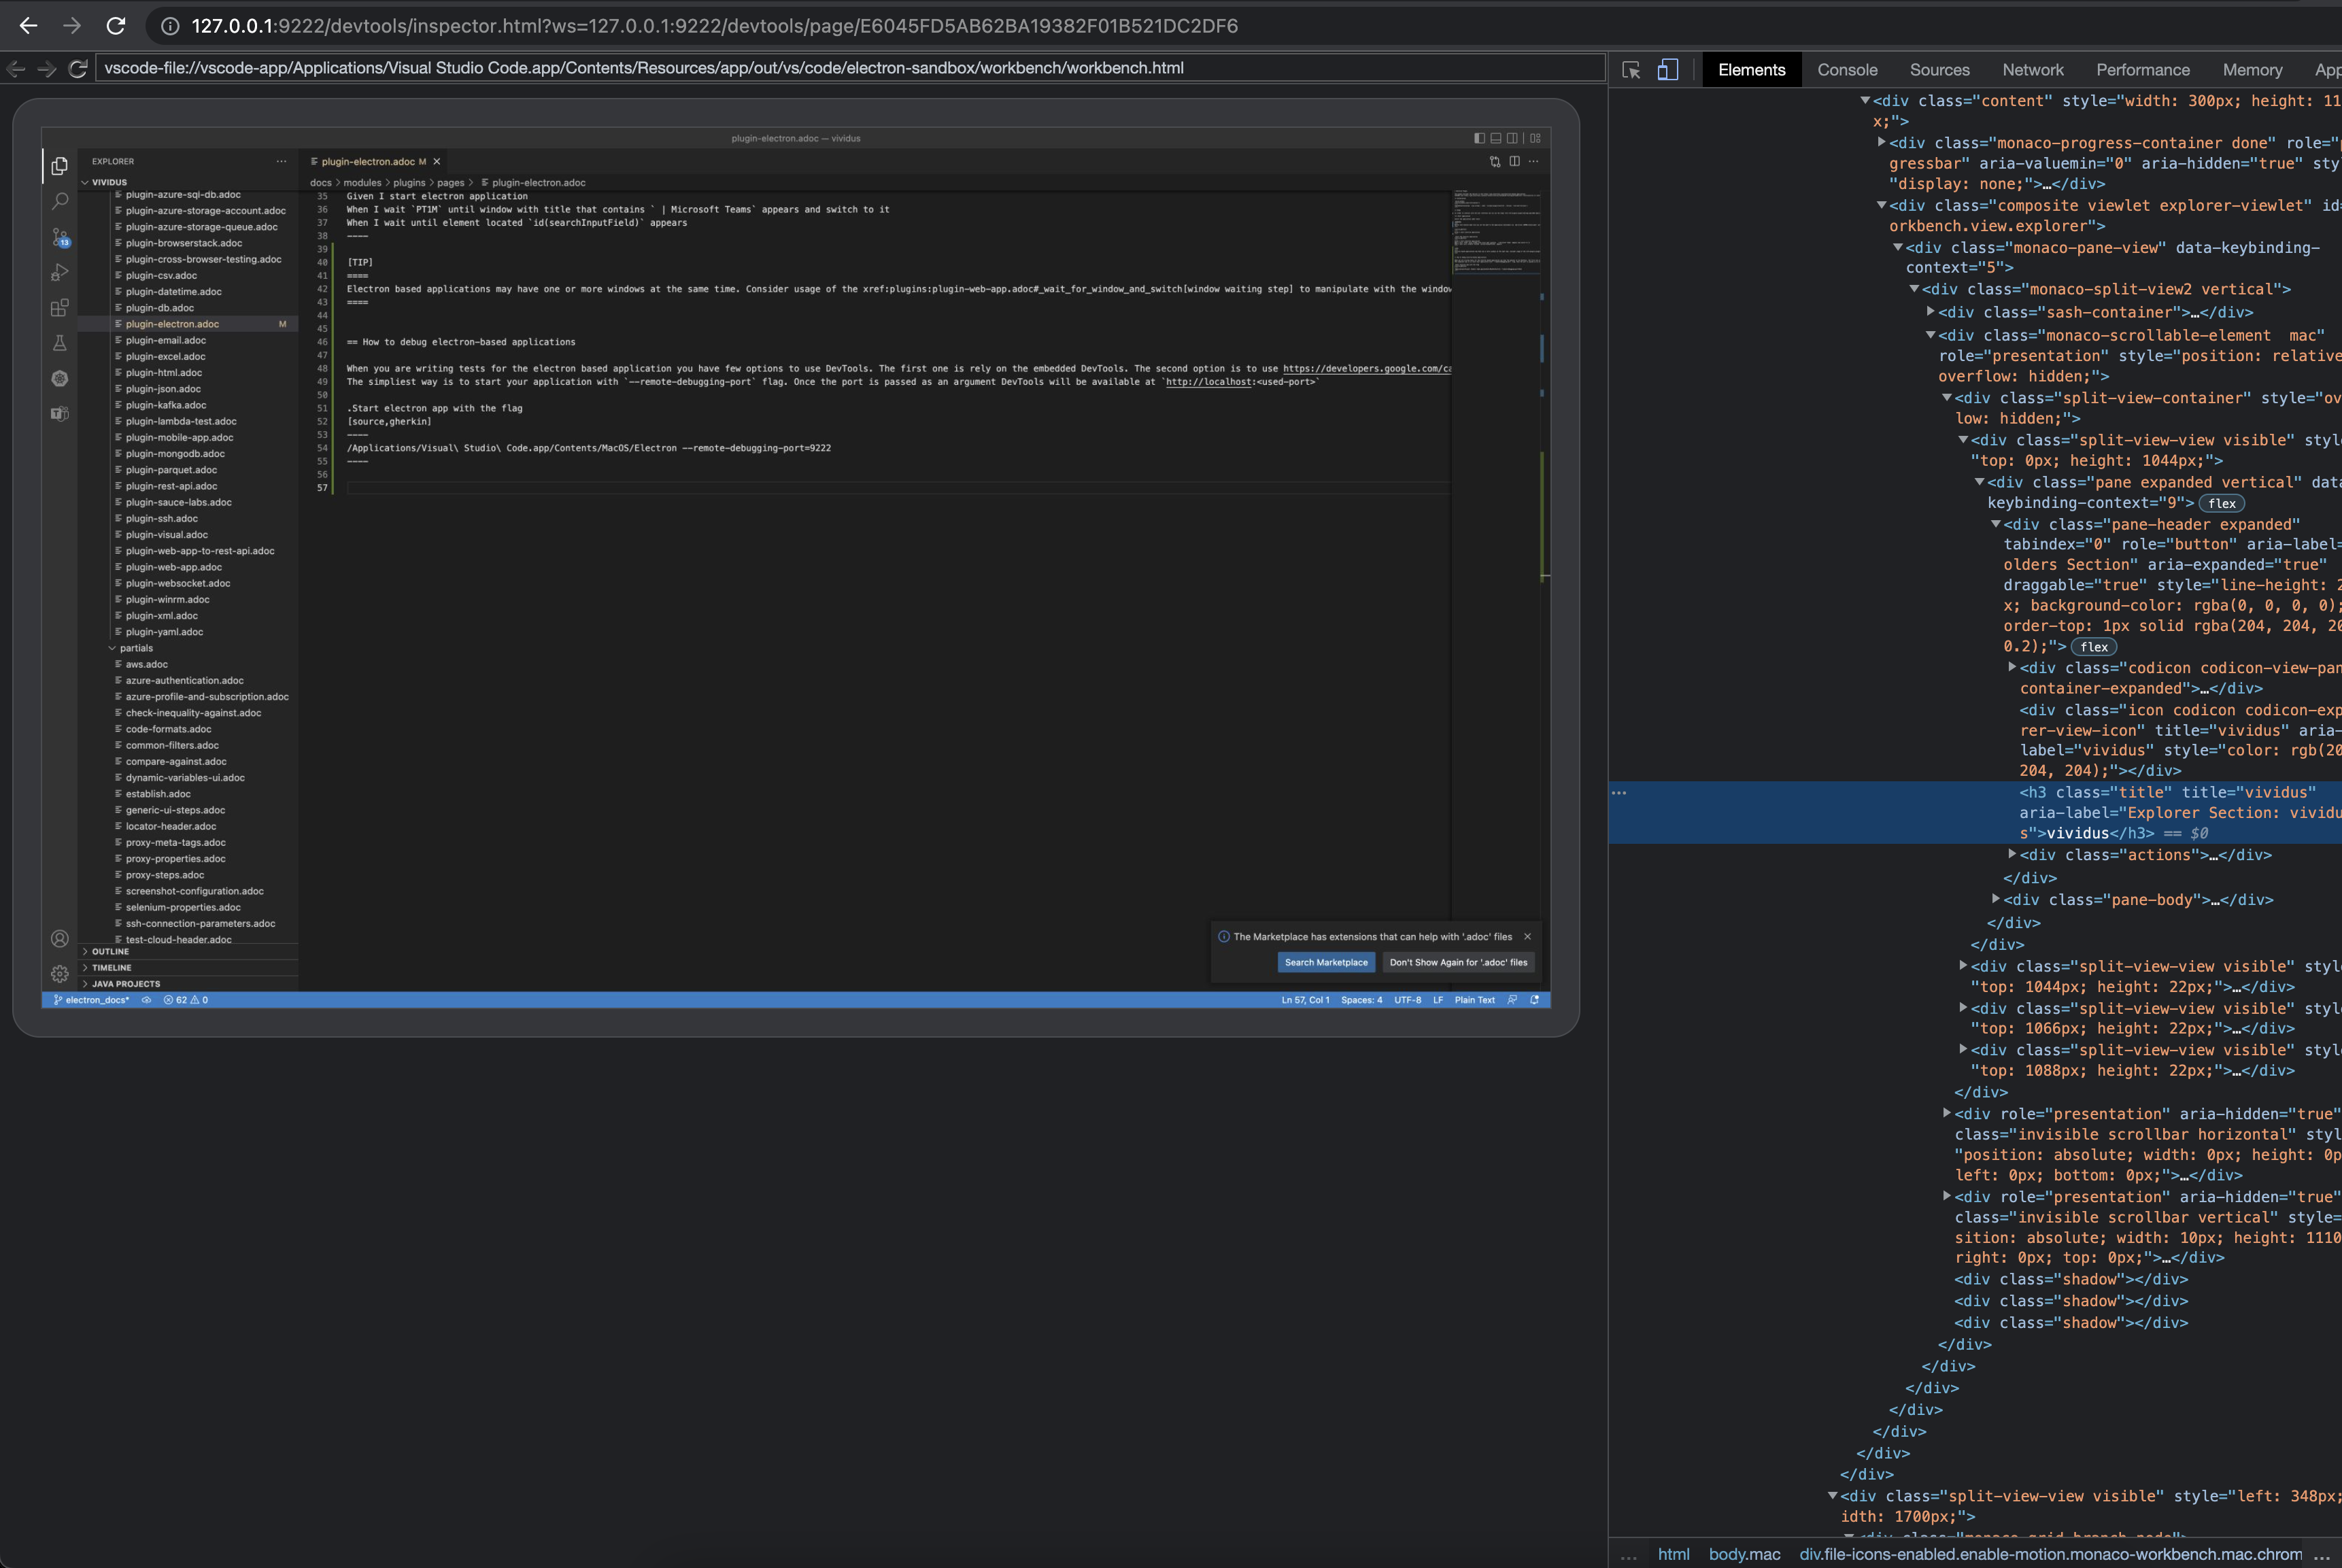
How to debug electron-based applications
When you are writing tests for the electron based application you have few options to use DevTools. The first one relies on the embedded DevTools. The second option is to use remote DevTools debugging.
The simplest way is to start your application with --remote-debugging-port=<port> flag. Once the port is passed as an argument, DevTools will be available at http://localhost:<port>;
/Applications/Visual\ Studio\ Code.app/Contents/MacOS/Electron --remote-debugging-port=9222